Style
Supply Chain Diagram Maker
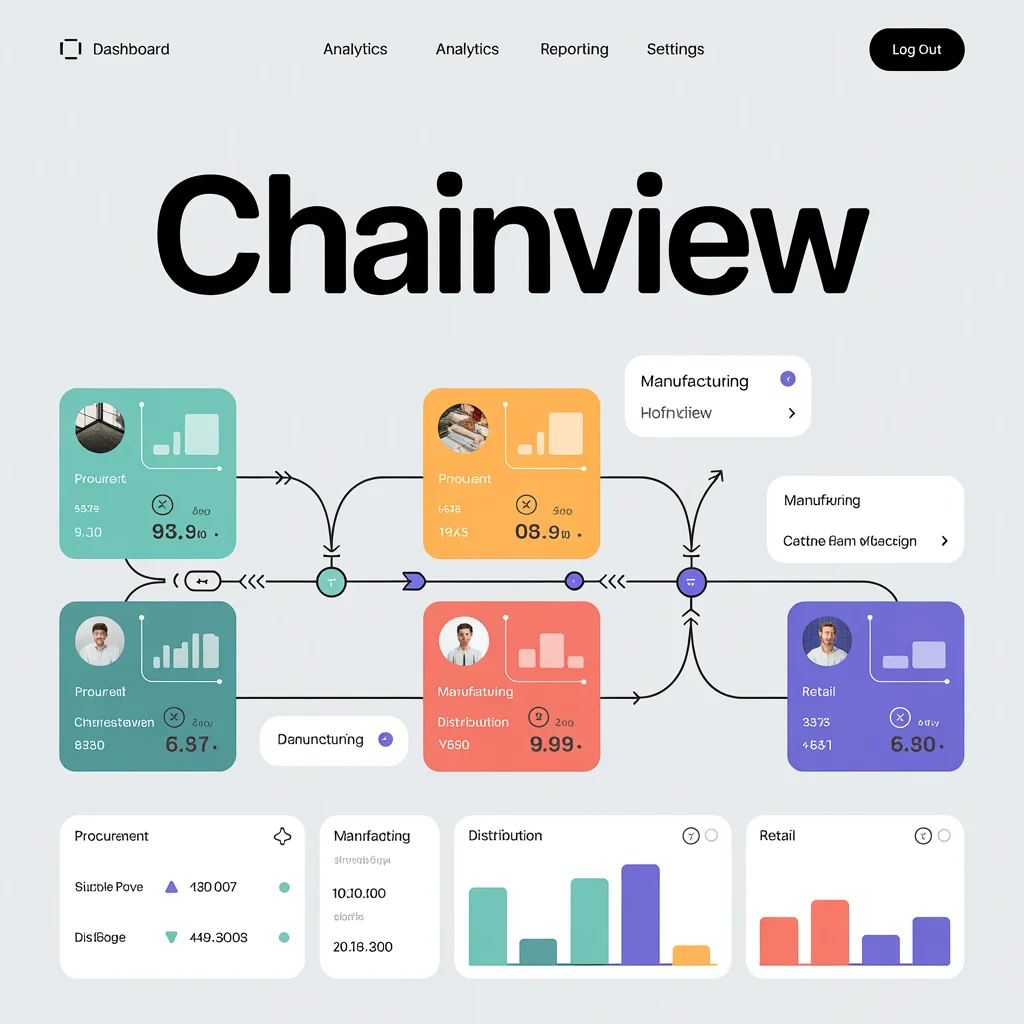
The Supply Chain Diagram Maker style is tailored for logistics and supply chain professionals seeking clear, modern, and visually vibrant process diagrams. This effect transforms complex logistical flows into easy-to-understand visuals with clean layouts, bold arrows, and contemporary iconography. It’s ideal for presentations, reports, and digital dashboards where clarity and professionalism are key.
Train AI Image Models
Train your own Character
Train a unique character from your own everyday photos, apply the ready to use Supply Chain Diagram Maker to generate interesting and eye-catching images.

Input Image
Starting point for AI training is set of your images. More images of same character can be added to improve the model.
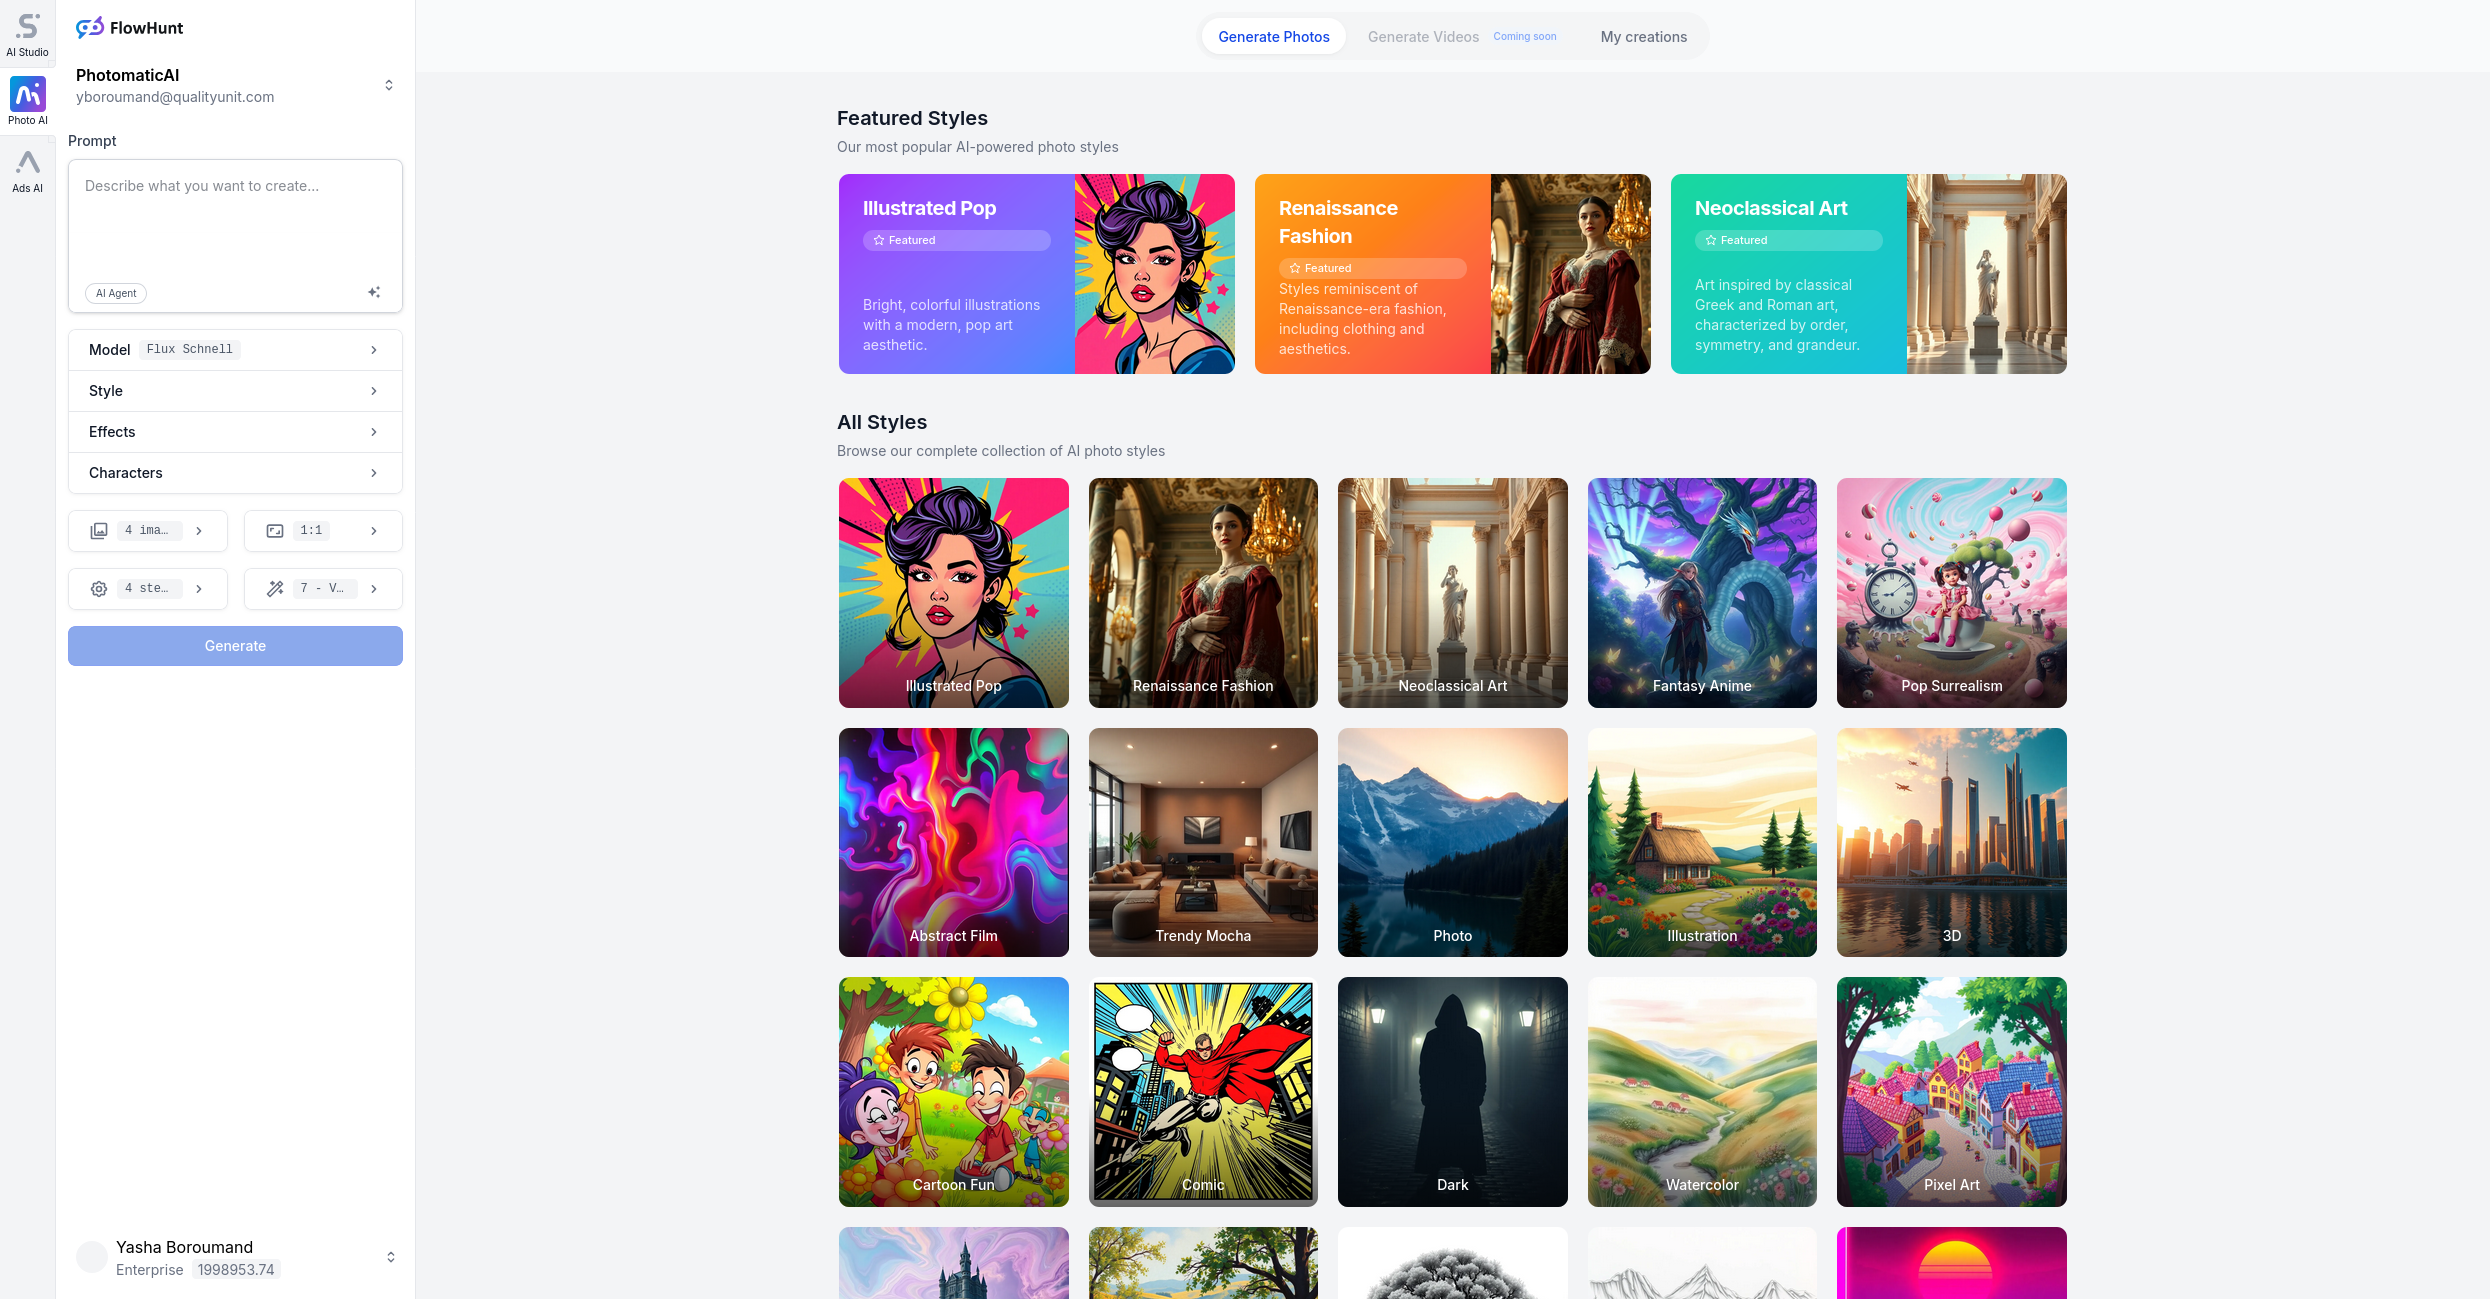
Pretrained AI model
Apply ready to use styles and effects on pretrained model or use custom prompt to generate images.


AI Generated Character with custom style
Images generated from the pretrained model
Visualize Your Supply Chain Instantly
Streamline your logistics presentations with the Photomatic AI image generator. Create clean, modern, and vibrant supply chain diagrams in seconds—perfect for business meetings, reports, and strategic planning.
What is Supply Chain Diagram Maker? Description and History
The Supply Chain Diagram Maker style leverages modern design principles to present complex logistics and supply chain networks in a visually digestible way. By combining vibrant colors, process arrows, and clean layouts, it transforms intricate workflows into clear, actionable visuals.
Historically, supply chain diagrams were hand-drawn or assembled using basic vector tools, often resulting in cluttered or uninspiring graphics. As digital business communication evolved, the need for visually compelling, easy-to-read diagrams became essential. Today, AI-powered tools like Photomatic automate this process, producing polished diagrams instantly and reducing the need for manual design skills.
Who is Using Supply Chain Diagram Maker?
- Logistics and Operations Managers: To map and optimize transportation, warehousing, and distribution processes.
- Business Consultants: For client presentations on process improvements or strategic planning.
- Educators: To illustrate supply chain concepts in business courses or training materials.
- Manufacturers: For internal communications and process documentation.
- Tech Companies: To visualize software-driven logistics solutions and workflows.
Examples of this effect
Supply Chain Flow
Prompt: supply chain diagram, process visuals, clean layout, vibrant colors, modern design
Distribution Network
Prompt: distribution network diagram, shipping containers, global map, stylized icons, contemporary vibrant look
Logistics Workflow
Prompt: logistics workflow, arrows connecting factories, trucks, warehouses, modern flat design, colorful and clean
Image generation error or unavailable.
How Does Supply Chain Diagram Maker Enhance Photos?
- Clarity and Simplicity: Distills complex process flows into easy-to-read diagrams.
- Modern Visuals: Uses contemporary color palettes and flat design for a professional look.
- Intuitive Icons: Stylized icons for factories, trucks, containers, and more aid rapid understanding.
- Process Emphasis: Strategic arrows and layout highlight process progression and bottlenecks.
- Business-Ready: Ready-to-use visuals for reports, presentations, and internal documentation.
Use Cases for Supply Chain Diagram Maker: When and Why to Use It
1. Logistics Presentations
Use for stakeholder meetings and pitches to quickly communicate intricate supply chain flows.
2. Process Optimization Workshops
Diagram current and future-state logistics, highlighting areas for improvement or automation.
3. Training Materials
Educators and HR teams can illustrate supply chain concepts for onboarding and skills development.
4. Digital Dashboards
Integrate diagrams into business intelligence dashboards for real-time process monitoring.
5. Client Reports
Consultants and analysts can visualize findings and recommendations with custom, branded diagrams.
Pro Tips for Using Supply Chain Diagram Maker
- Be Specific in Prompts: Clearly describe your process or network for best AI results.
- Keep It Clean: Avoid overloading diagrams with too many elements—clarity is key.
- Highlight Key Steps: Use contrasting colors or larger icons for critical process points.
- Iterate for Perfection: Generate multiple diagrams for comparison and refinement.
- Integrate with Branding: Download and edit diagrams to match your company’s visual identity.
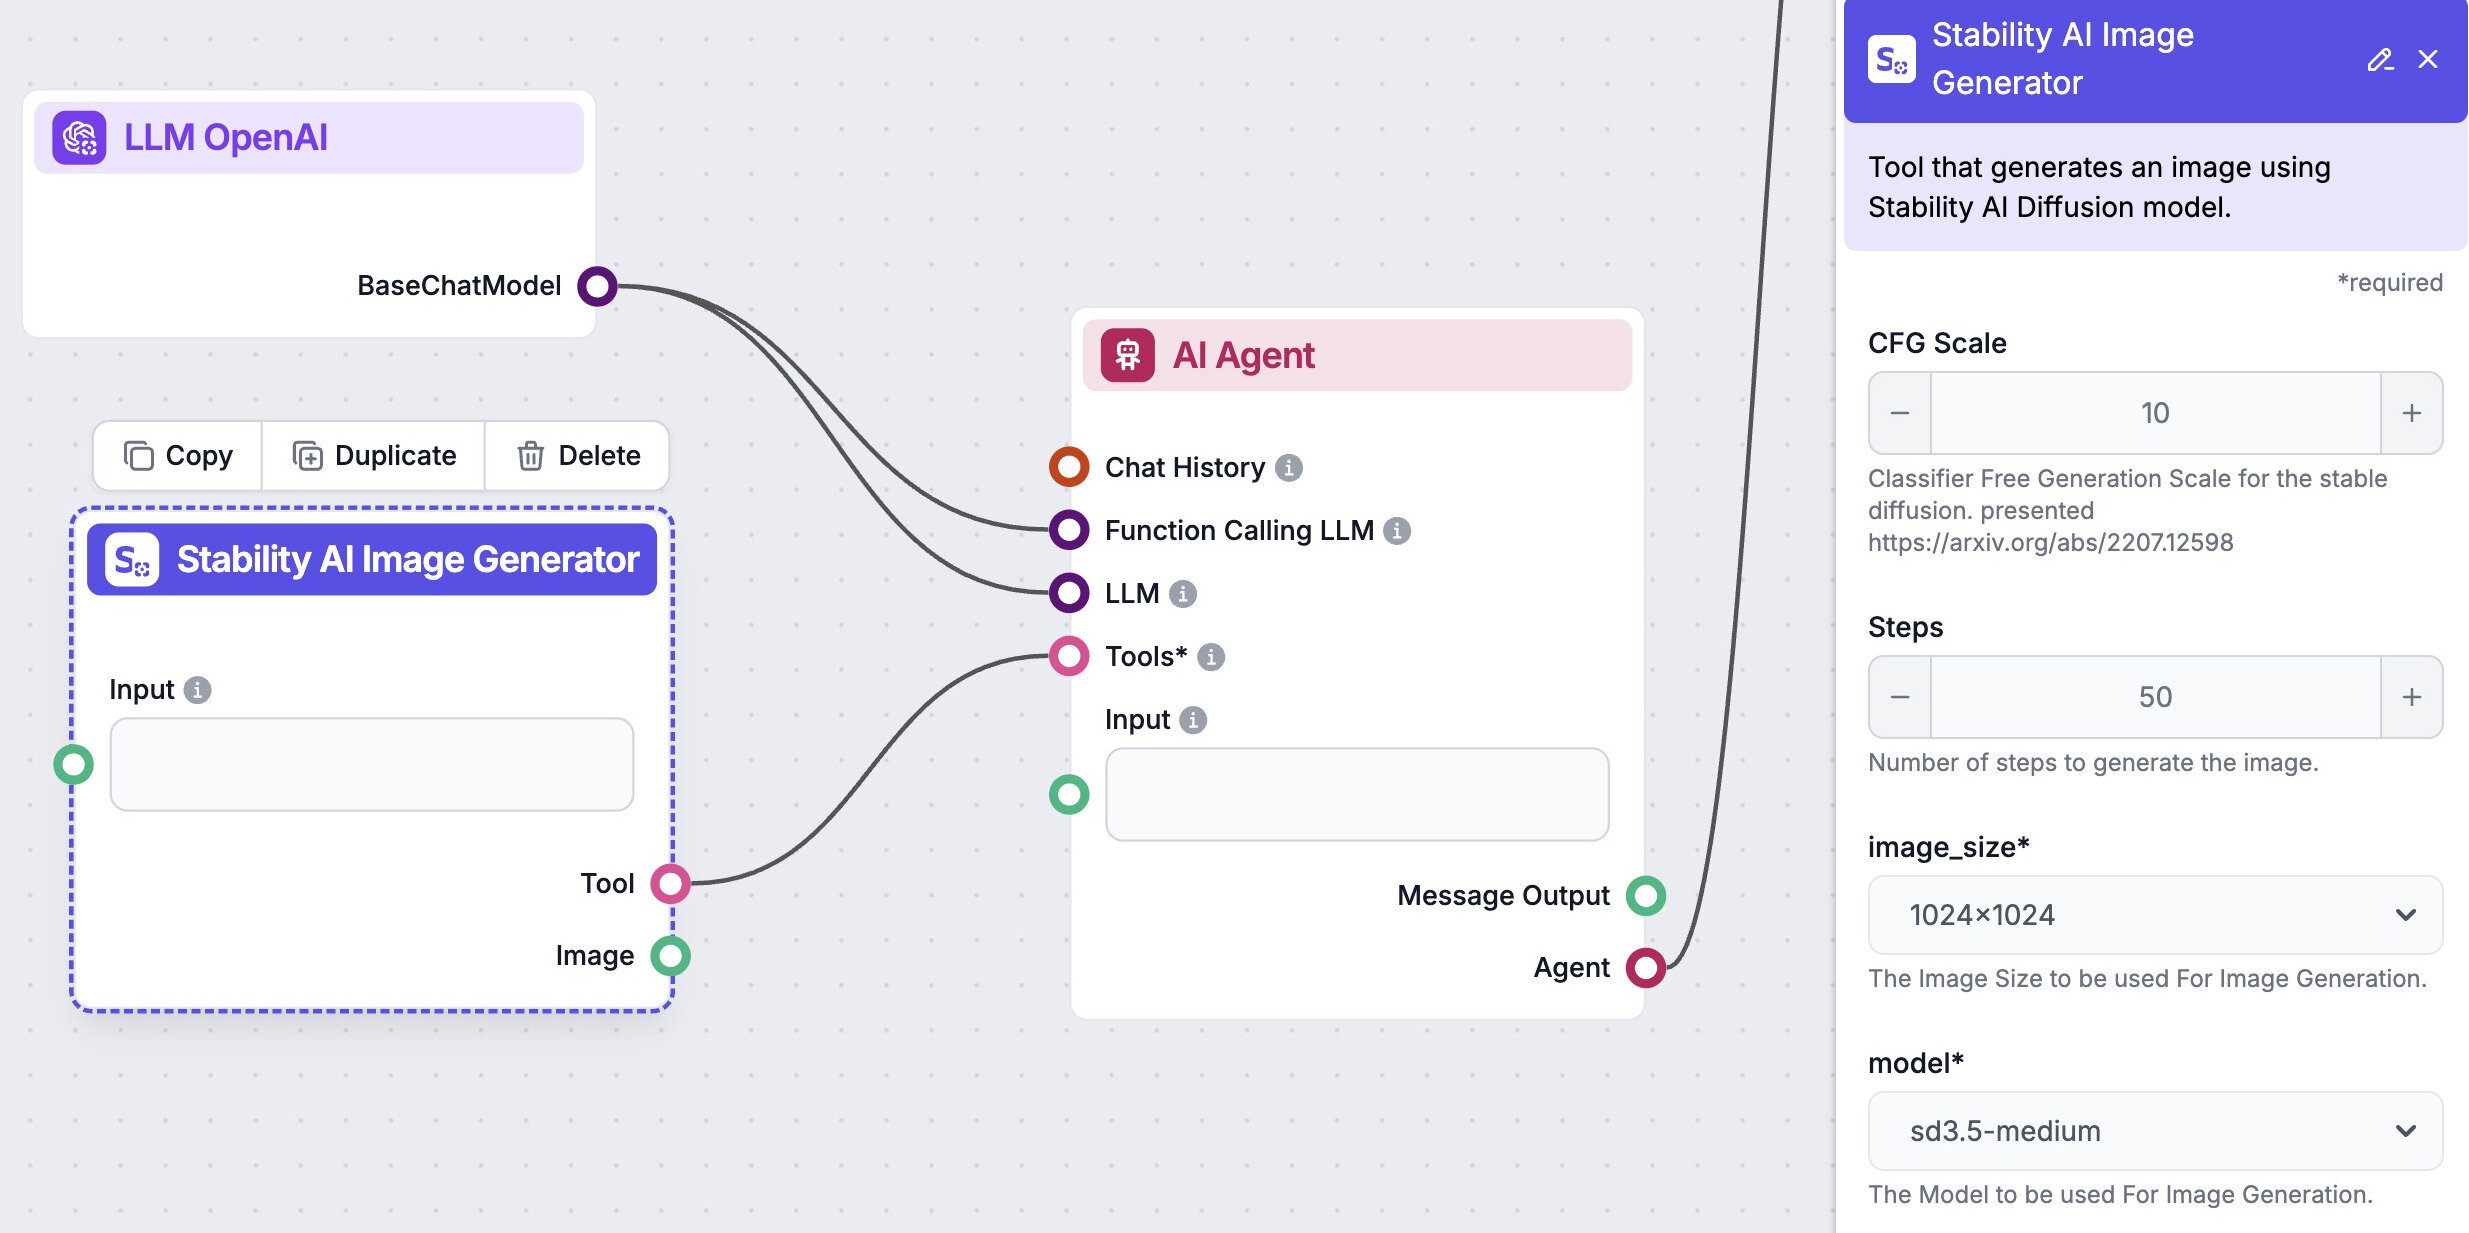
Automate your image generation with AI Agents
Generate At Scale With The Supply Chain Diagram Maker
Frequently asked questions
- What is the Supply Chain Diagram Maker effect?
This effect generates clear, visually engaging diagrams representing supply chain or logistics processes. It emphasizes clean layouts, vibrant colors, and intuitive icons to simplify complex flows and make them easy to understand.
- How can I create supply chain diagrams with this tool?
Simply input your desired prompt describing the supply chain process, and the AI will generate a professional, modern diagram tailored to your needs. The style ensures clarity and visual appeal for business use.
- Who should use Supply Chain Diagram Maker?
This tool is ideal for logistics managers, supply chain analysts, business consultants, educators, and anyone needing to communicate process flows or logistical structures with clarity.
- Can I customize the diagrams further?
Yes. While the AI generates a polished base image, you can refine or annotate the output using your preferred graphic editing tools for additional customization.
- Are these diagrams suitable for presentations and reports?
Absolutely. The clean, modern design ensures that your diagrams look professional and are easy to integrate into slides, reports, dashboards, and client deliverables.
We automate marketing with AI
Let us help you automate your marketing tasks. Our platform allows you to create custom AI chatbots, agents, and workflows that can handle a wide range of tasks, from customer support to content generation.
- High-Quality Visual Content
Generate professional marketing visuals in seconds. Our AI creates stunning images that maintain brand consistency across all your campaigns without expensive design services.
- Content Creation at Scale
Produce large volumes of customized content efficiently. Create hundreds of images, blog posts, and marketing materials simultaneously with our AI automation workflows.
- Custom Brand Identity
Train AI models on your brand assets to create unique, on-brand visuals for any campaign. Maintain consistent visual identity across all marketing channels with character training technology.