Style
Infographic Builder
The Infographic Builder style transforms raw data into visually compelling, data-driven infographics perfect for business reports, marketing presentations, and educational content. With a focus on clean design, vibrant color palettes, and intuitive layouts, this effect makes complex information immediately accessible, engaging, and memorable. Infographic Builder is ideal for professionals who need to communicate analytics, trends, or statistics in a visually impactful way.
Train AI Image Models
Train your own Character
Train a unique character from your own everyday photos, apply the ready to use Infographic Builder to generate interesting and eye-catching images.

Input Image
Starting point for AI training is set of your images. More images of same character can be added to improve the model.
Pretrained AI model
Apply ready to use styles and effects on pretrained model or use custom prompt to generate images.


AI Generated Character with custom style
Images generated from the pretrained model
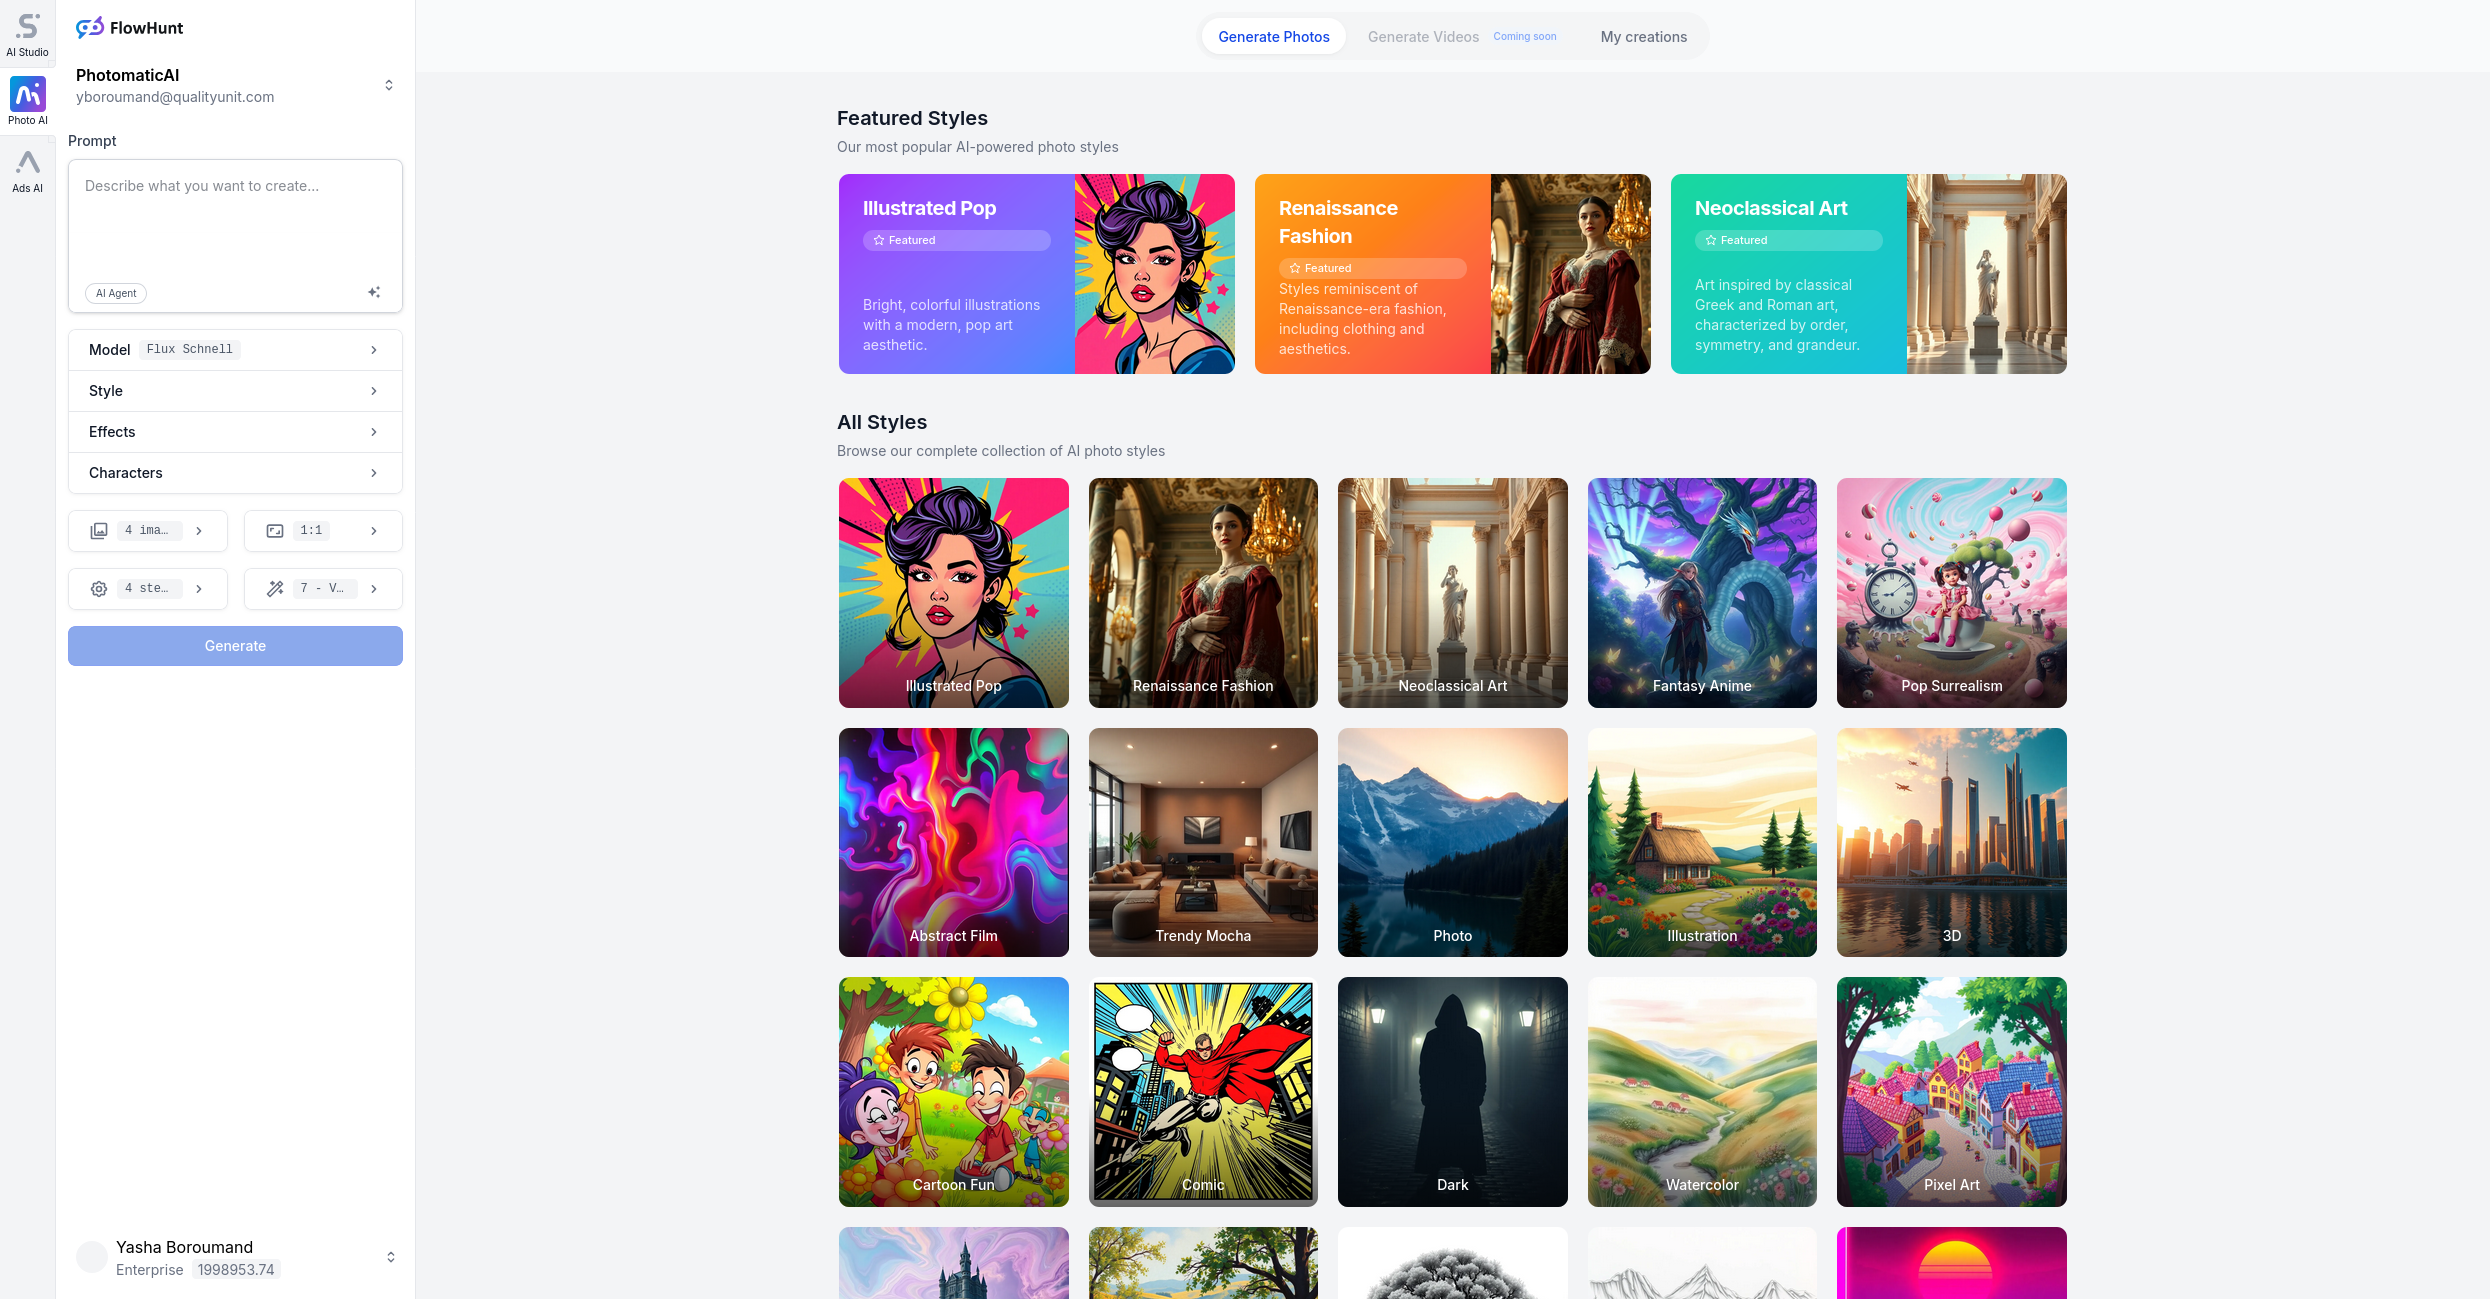
Transform Data into Stunning Infographics
Elevate your business reports and marketing materials with the Infographic Builder style using our Photomatic AI image generator. Visualize data in bold, colorful, and professional layouts in just a few clicks!
What is Infographic Builder? Description and History
Infographic Builder is a specialized visual style designed to turn raw data, statistics, and business insights into clear, captivating infographics. By blending the science of data visualization with principles of modern graphic design, this style helps transform numbers and trends into stories that are easy to digest and hard to forget.
The history of infographics dates back to early scientific diagrams and public health charts in the 19th century, but the digital era has supercharged their popularity. Today, infographics are a staple in business, marketing, news, and education—making complex information accessible at a glance. Tools like Photomatic’s Infographic Builder democratize this power, allowing anyone to create professional, data-driven visuals without design expertise.
Who is Using Infographic Builder?
- Business Analysts and Executives: To summarize quarterly results, KPIs, and market trends in board meetings or shareholder reports.
- Marketers and Brand Managers: For campaign performance overviews, customer personas, and competitive analysis in eye-catching layouts.
- Educators and Researchers: To visualize survey results, processes, or academic findings for lectures or publications.
- Journalists and Content Creators: For data-driven storytelling in news articles or social media posts.
- Nonprofits and NGOs: To illustrate impact metrics and fundraising results for stakeholders and donors.
Examples of this effect
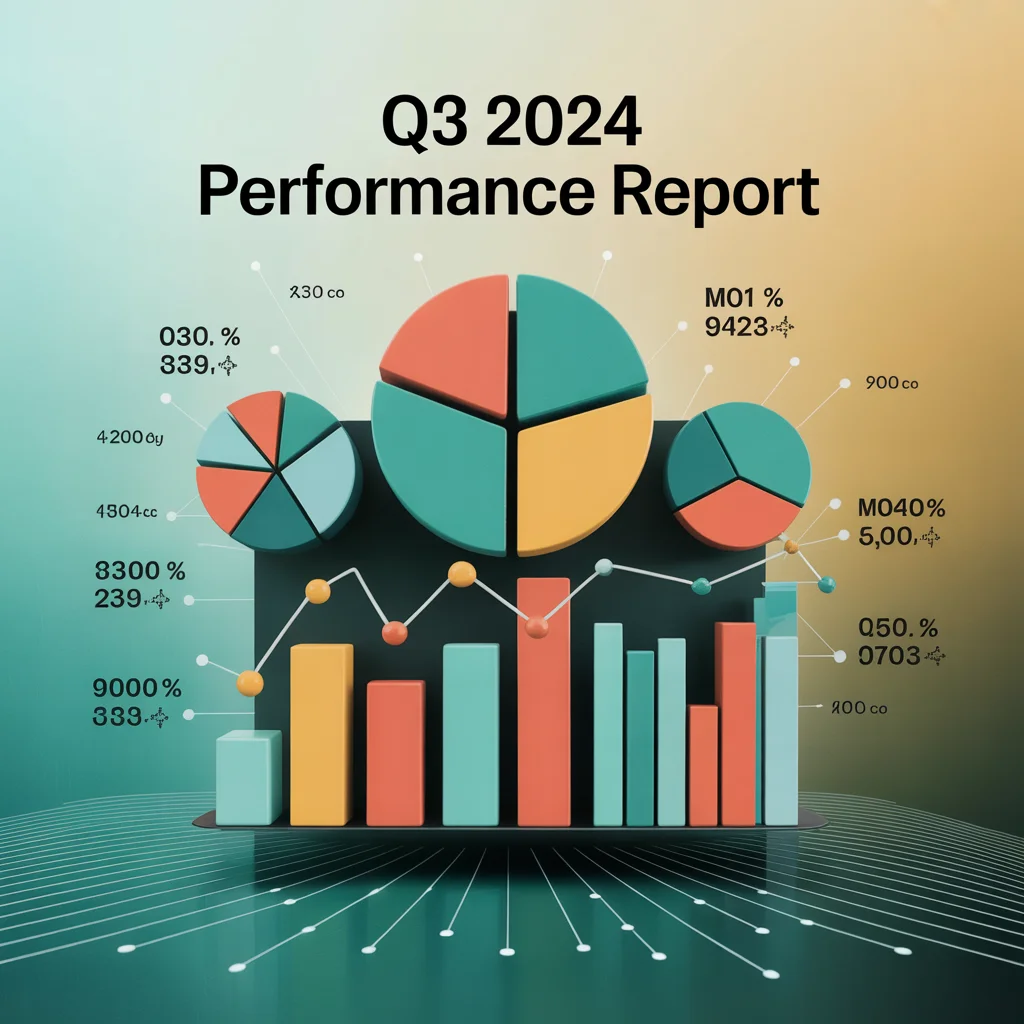
Pie Chart
Prompt: “infographic, data visualization, clean design, vibrant colors, business stats, pie charts and bar graphs”
Sleek Report
Prompt: “infographic, modern business report, clean layout, icons and charts, vibrant color palette”
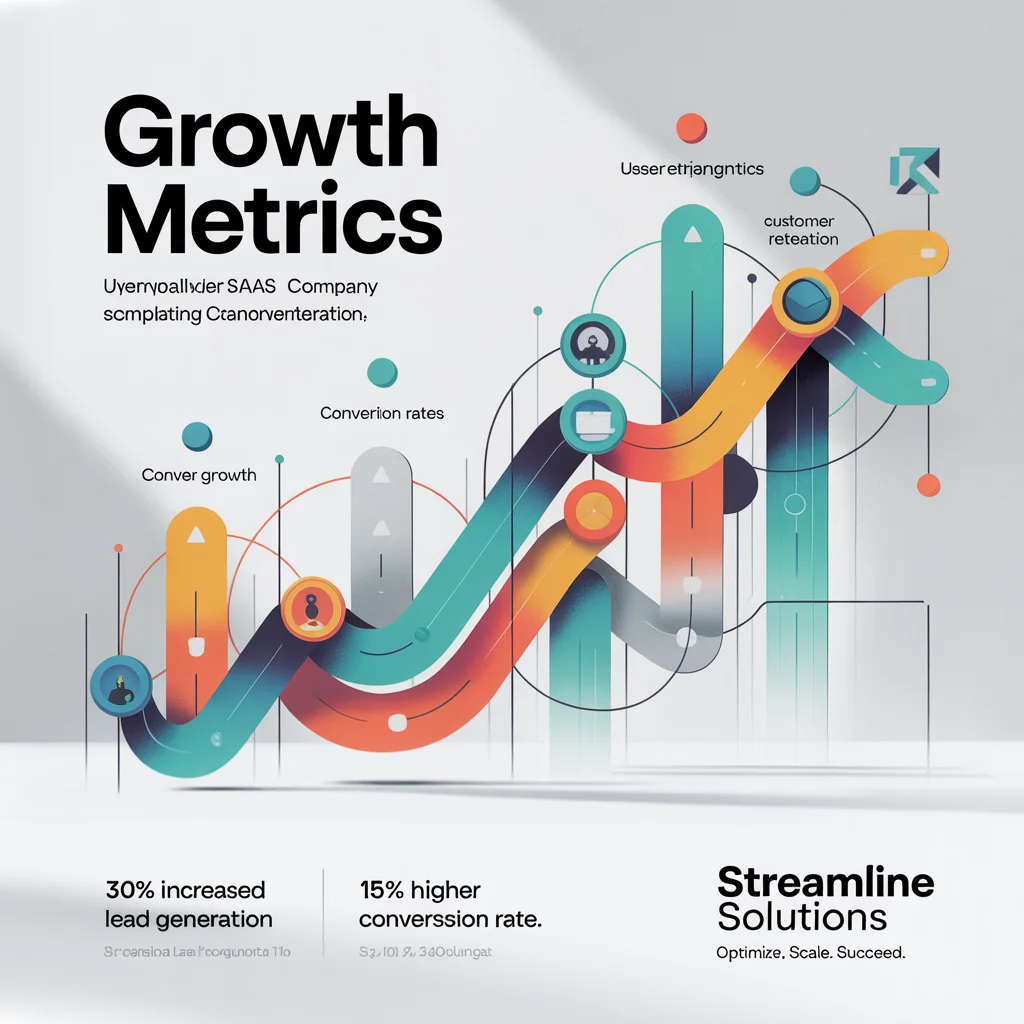
Marketing Stats
Prompt: “infographic, marketing statistics, bold data visualization, sleek design, colorful business graphics”
How Does Infographic Builder Enhance Photos?
- Clarity and Focus: Transforms cluttered spreadsheets and tables into easy-to-read graphics, highlighting what matters most.
- Vibrant Colors: Uses bold, consistent color schemes to make information pop and improve retention.
- Clean Design: Employs whitespace, iconography, and intuitive layouts for a modern, professional appearance.
- Storytelling Power: Organizes data visually, guiding the viewer through key insights and trends.
- Instant Communication: Makes even complex data understandable at a glance, perfect for busy audiences.
Use Cases for Infographic Builder: When and Why to Use It
1. Quarterly Business Reports
Summarize key financials, growth metrics, and milestones with engaging pie charts and bar graphs that impress stakeholders and clarify performance.
2. Marketing Campaign Overviews
Visualize ad spend, conversion rates, and demographic breakdowns for clients or internal teams using sleek, on-brand infographics.
3. Educational Materials
Transform survey results, scientific processes, or historical timelines into memorable visual aids for students and workshop participants.
4. Social Media Posts
Share bite-sized stats, trends, or lists on platforms like LinkedIn or Twitter, boosting engagement and shareability.
5. Event Recaps
Showcase attendee numbers, feedback, and highlights from trade shows or conferences in a single, visually rich graphic.
6. Nonprofit Impact Summaries
Demonstrate fundraising results, outreach efforts, and impact metrics for donors and volunteers in a transparent, compelling format.
Pro Tips for Using Infographic Builder
- Prioritize Key Data: Focus on the most important metrics or trends to avoid overwhelming viewers.
- Maintain Brand Consistency: Use your organization’s colors and fonts to reinforce brand identity.
- Mix Chart Types: Combine bar, line, and pie charts for a comprehensive yet varied presentation.
- Use Icons and Visual Cues: Enhance understanding with clear icons, progress circles, and simple illustrations.
- Keep it Simple: Less is often more—aim for clarity, not clutter.
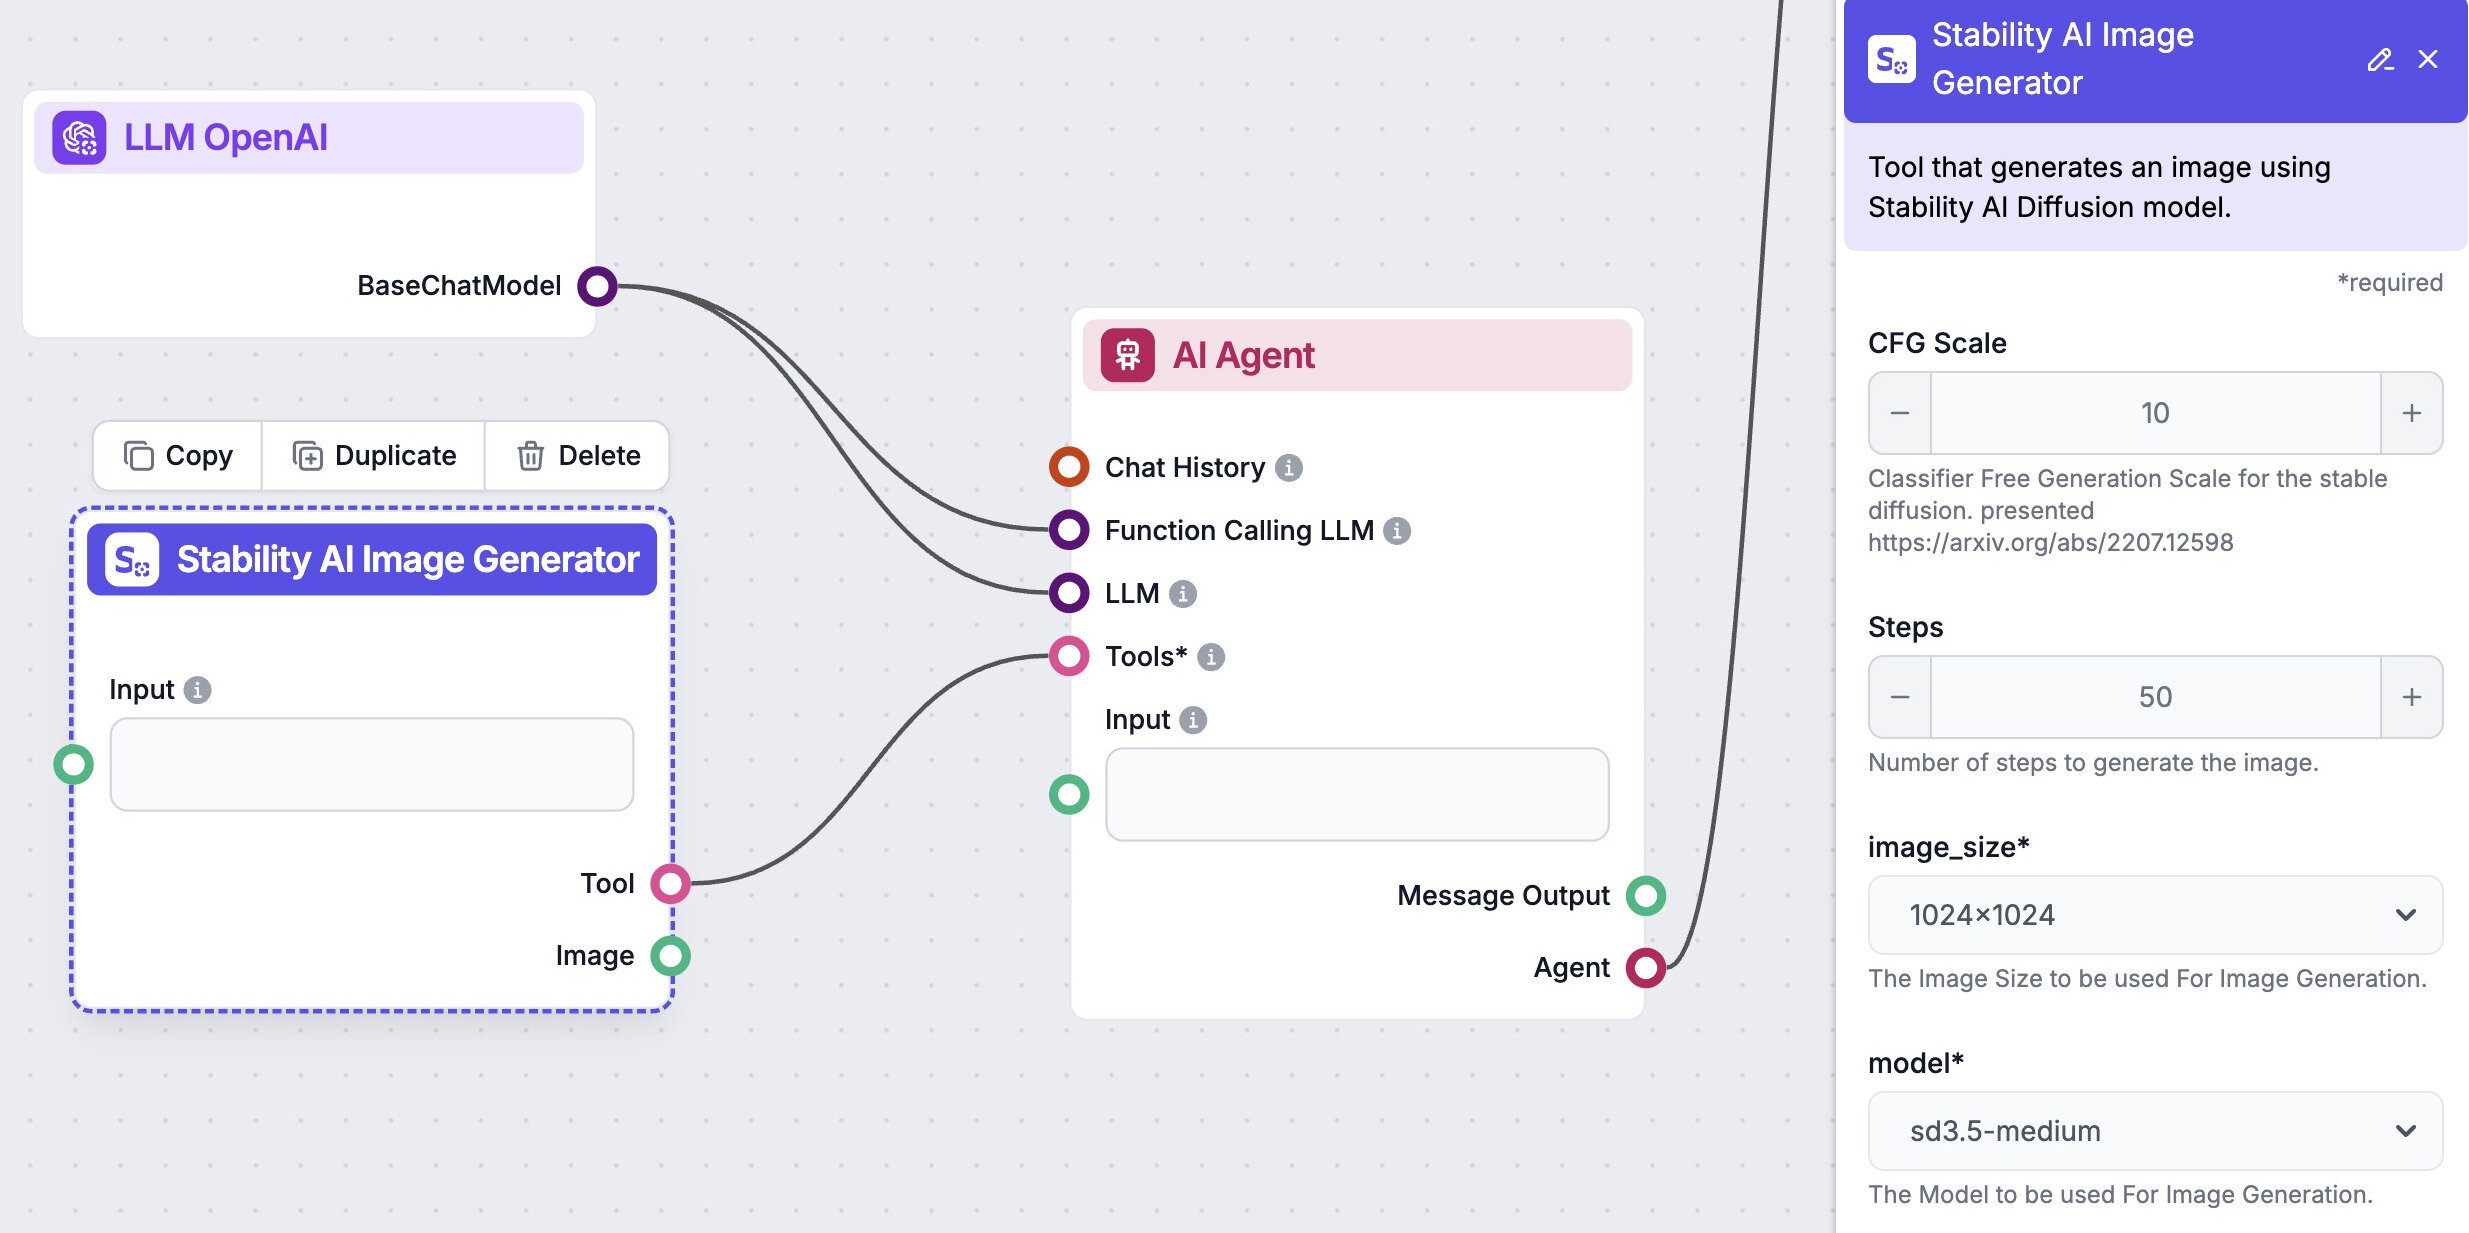
Automate your image generation with AI Agents
Generate At Scale With The Infographic Builder
Frequently asked questions
- What is the Infographic Builder effect?
The Infographic Builder effect uses AI to convert data and statistics into visually engaging infographics. It incorporates clean layouts, vibrant color schemes, and modern design elements to make complex information easy to understand and visually appealing.
- How do I create infographics with this style?
Simply use the Photomatic AI image generator and select the Infographic Builder style. Upload your data or describe the statistics you want visualized, and the tool creates professional infographics instantly.
- What types of content benefit most from Infographic Builder?
Business reports, marketing presentations, educational content, annual reviews, and social media posts all benefit from clear, visually engaging infographics that simplify complex data.
- Can I customize the color scheme and layout?
Yes, you can specify preferences for color palettes, chart types, and layout details, ensuring your infographic aligns with your brand or presentation style.
- Is Infographic Builder suitable for commercial use?
Absolutely. Infographic Builder is designed for professional use in business, marketing, publishing, and education. You can use the generated images in reports, presentations, websites, and campaigns.
We automate marketing with AI
Let us help you automate your marketing tasks. Our platform allows you to create custom AI chatbots, agents, and workflows that can handle a wide range of tasks, from customer support to content generation.
- High-Quality Visual Content
Generate professional marketing visuals in seconds. Our AI creates stunning images that maintain brand consistency across all your campaigns without expensive design services.
- Content Creation at Scale
Produce large volumes of customized content efficiently. Create hundreds of images, blog posts, and marketing materials simultaneously with our AI automation workflows.
- Custom Brand Identity
Train AI models on your brand assets to create unique, on-brand visuals for any campaign. Maintain consistent visual identity across all marketing channels with character training technology.