Style
Sustainability Report Visualizer
The Sustainability Report Visualizer applies clean, green, and vibrant aesthetics to business documents, transforming annual or quarterly reports into visually engaging eco-themed presentations. Utilizing nature-inspired elements, fresh color palettes, and modern layouts, this effect not only enhances report readability but also strengthens a company’s commitment to environmental responsibility. Perfect for organizations wishing to communicate sustainability initiatives with clarity and creative impact.
Train AI Image Models
Train your own Character
Train a unique character from your own everyday photos, apply the ready to use Sustainability Report Visualizer to generate interesting and eye-catching images.

Input Image
Starting point for AI training is set of your images. More images of same character can be added to improve the model.
Pretrained AI model
Apply ready to use styles and effects on pretrained model or use custom prompt to generate images.


AI Generated Character with custom style
Images generated from the pretrained model
Visualize Your Sustainability Reports with Eco-Themed Designs
Transform traditional business documents into vibrant, eco-conscious visuals using the Sustainability Report Visualizer powered by Photomatic AI. Engage your audience and highlight your green initiatives with stunning, clean, and modern visuals.
What is the Sustainability Report Visualizer? Description and History
The Sustainability Report Visualizer is a modern design approach that transforms traditional business reports into visually appealing, eco-themed documents. It leverages green color palettes, clean layouts, nature-inspired graphics (like leaves, earth motifs, and sustainability icons), and vibrant accents to communicate an organization’s commitment to environmental responsibility.
Historically, business reports have been dense and text-heavy, often lacking visual appeal. As sustainability became a core value for many organizations, there was a growing need to present data and achievements in an engaging, transparent, and easily digestible format. The Sustainability Report Visualizer emerged from the intersection of graphic design, environmental awareness, and digital reporting, helping companies effectively narrate their green journey.
Who is Using the Sustainability Report Visualizer?
- Corporate Sustainability Teams: To communicate annual environmental goals, progress, and results.
- Nonprofits and NGOs: Showcasing eco-friendly initiatives and impact assessments.
- Marketing and PR Agencies: Designing compelling sustainability stories for clients.
- Startups and Green Tech Companies: Presenting eco-innovations to stakeholders and investors.
- Educational Institutions: Illustrating campus sustainability efforts and research.
- Consultancies: Visualizing environmental audit findings and recommendations.
Examples of this effect
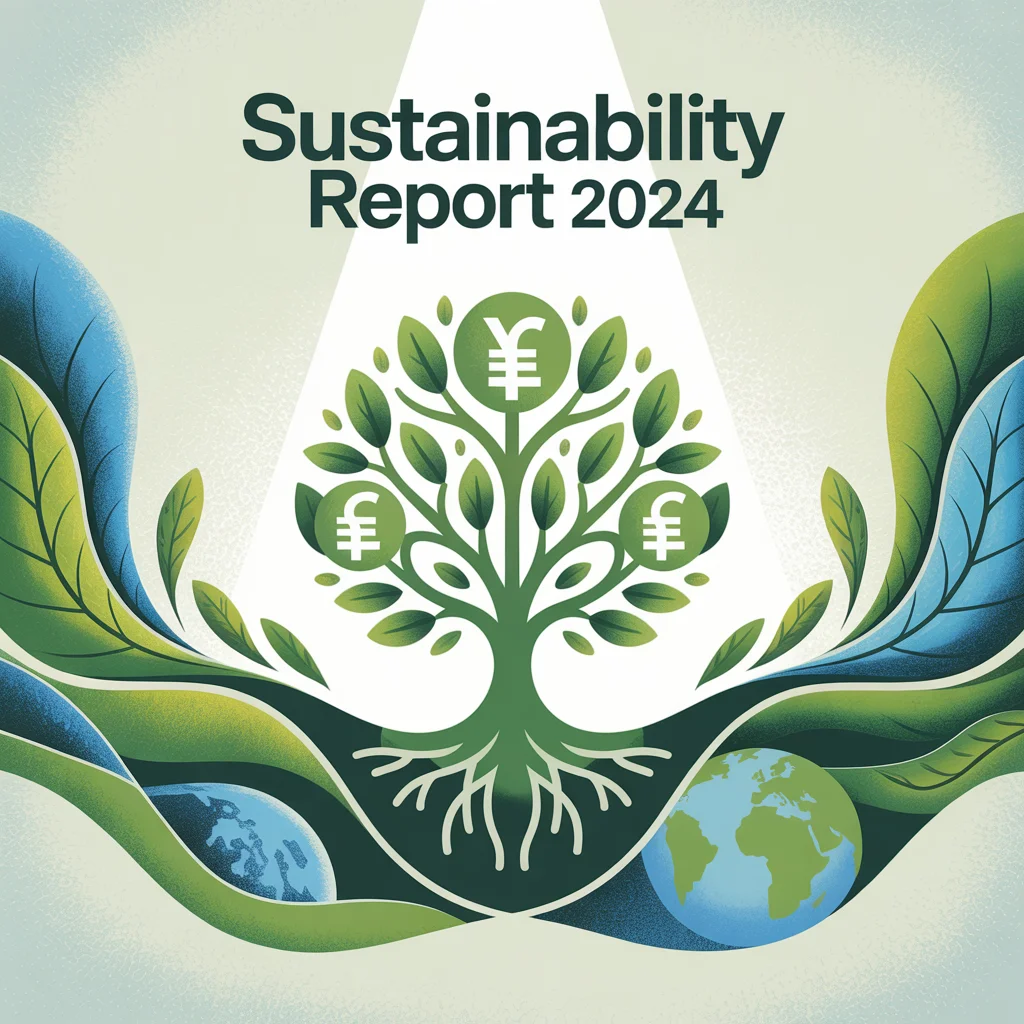
Infographic Cover
Prompt: sustainability report, green visuals, clean design, vibrant colors, eco theme, infographic style, nature-inspired elements, leaves and earth motifs
Modern Presentation
Prompt: eco-friendly business presentation, modern layout, sustainability icons, fresh green color palette, minimalistic yet vibrant, report cover visual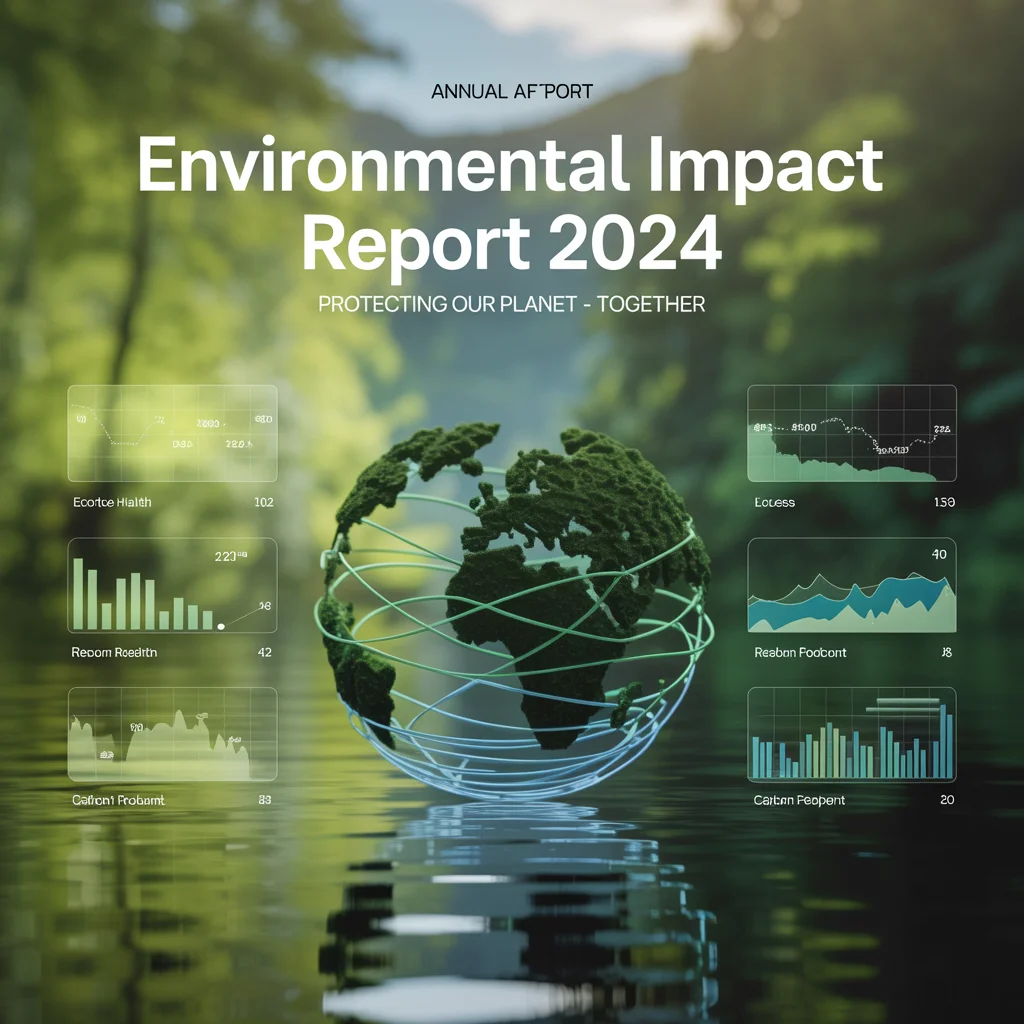
Environmental Impact Report
Prompt: annual environmental impact report, clean and professional, charts with green and blue accents, eco-conscious design, nature backgrounds
How Does the Sustainability Report Visualizer Enhance Photos?
- Eco-Friendly Aesthetics: Infuses reports with green tones, leaf and earth motifs, and nature-inspired backgrounds to reinforce an environmental message.
- Clean and Professional Layouts: Ensures clarity, organization, and a polished look, making complex data easy to digest.
- Vibrant Color Accents: Uses bold greens, blues, and earth tones to highlight key metrics and achievements.
- Infographic Elements: Incorporates charts, icons, and illustrations to simplify data presentation and engage audiences.
- Consistency in Branding: Aligns visuals with a company’s sustainability vision and brand identity.
These enhancements make reports more engaging, memorable, and effective at communicating green achievements and goals.
Use Cases for the Sustainability Report Visualizer: When and Why to Use It
1. Annual Sustainability Reports
Turn your yearly environmental performance summaries into visually rich documents that inspire stakeholders and reinforce your company’s green commitment.
2. Investor and Stakeholder Presentations
Impress investors with compelling, eco-friendly visuals that highlight your sustainability metrics and future goals.
3. Green Marketing Materials
Create flyers, posters, and digital assets for campaigns promoting eco-initiatives and corporate responsibility.
4. Employee Engagement
Share visually appealing internal reports that motivate teams and celebrate sustainability milestones.
5. NGO and Nonprofit Communications
Visualize the impact of projects, donations, and advocacy efforts, making it easier to share progress with supporters and partners.
6. Educational Content
Design lesson materials and research reports that bring environmental data to life for students and researchers.
Pro Tips for Using the Sustainability Report Visualizer
- Prioritize Legibility: Choose clean fonts and layouts to ensure information is easy to read.
- Use Consistent Iconography: Employ a unified set of sustainability icons for clarity and professionalism.
- Embrace White Space: Give visuals room to breathe for a modern, uncluttered feel.
- Highlight Key Metrics: Use vibrant color blocks or infographics to showcase important numbers.
- Align with Brand Colors: Integrate your organization’s palette to maintain brand recognition while emphasizing green values.
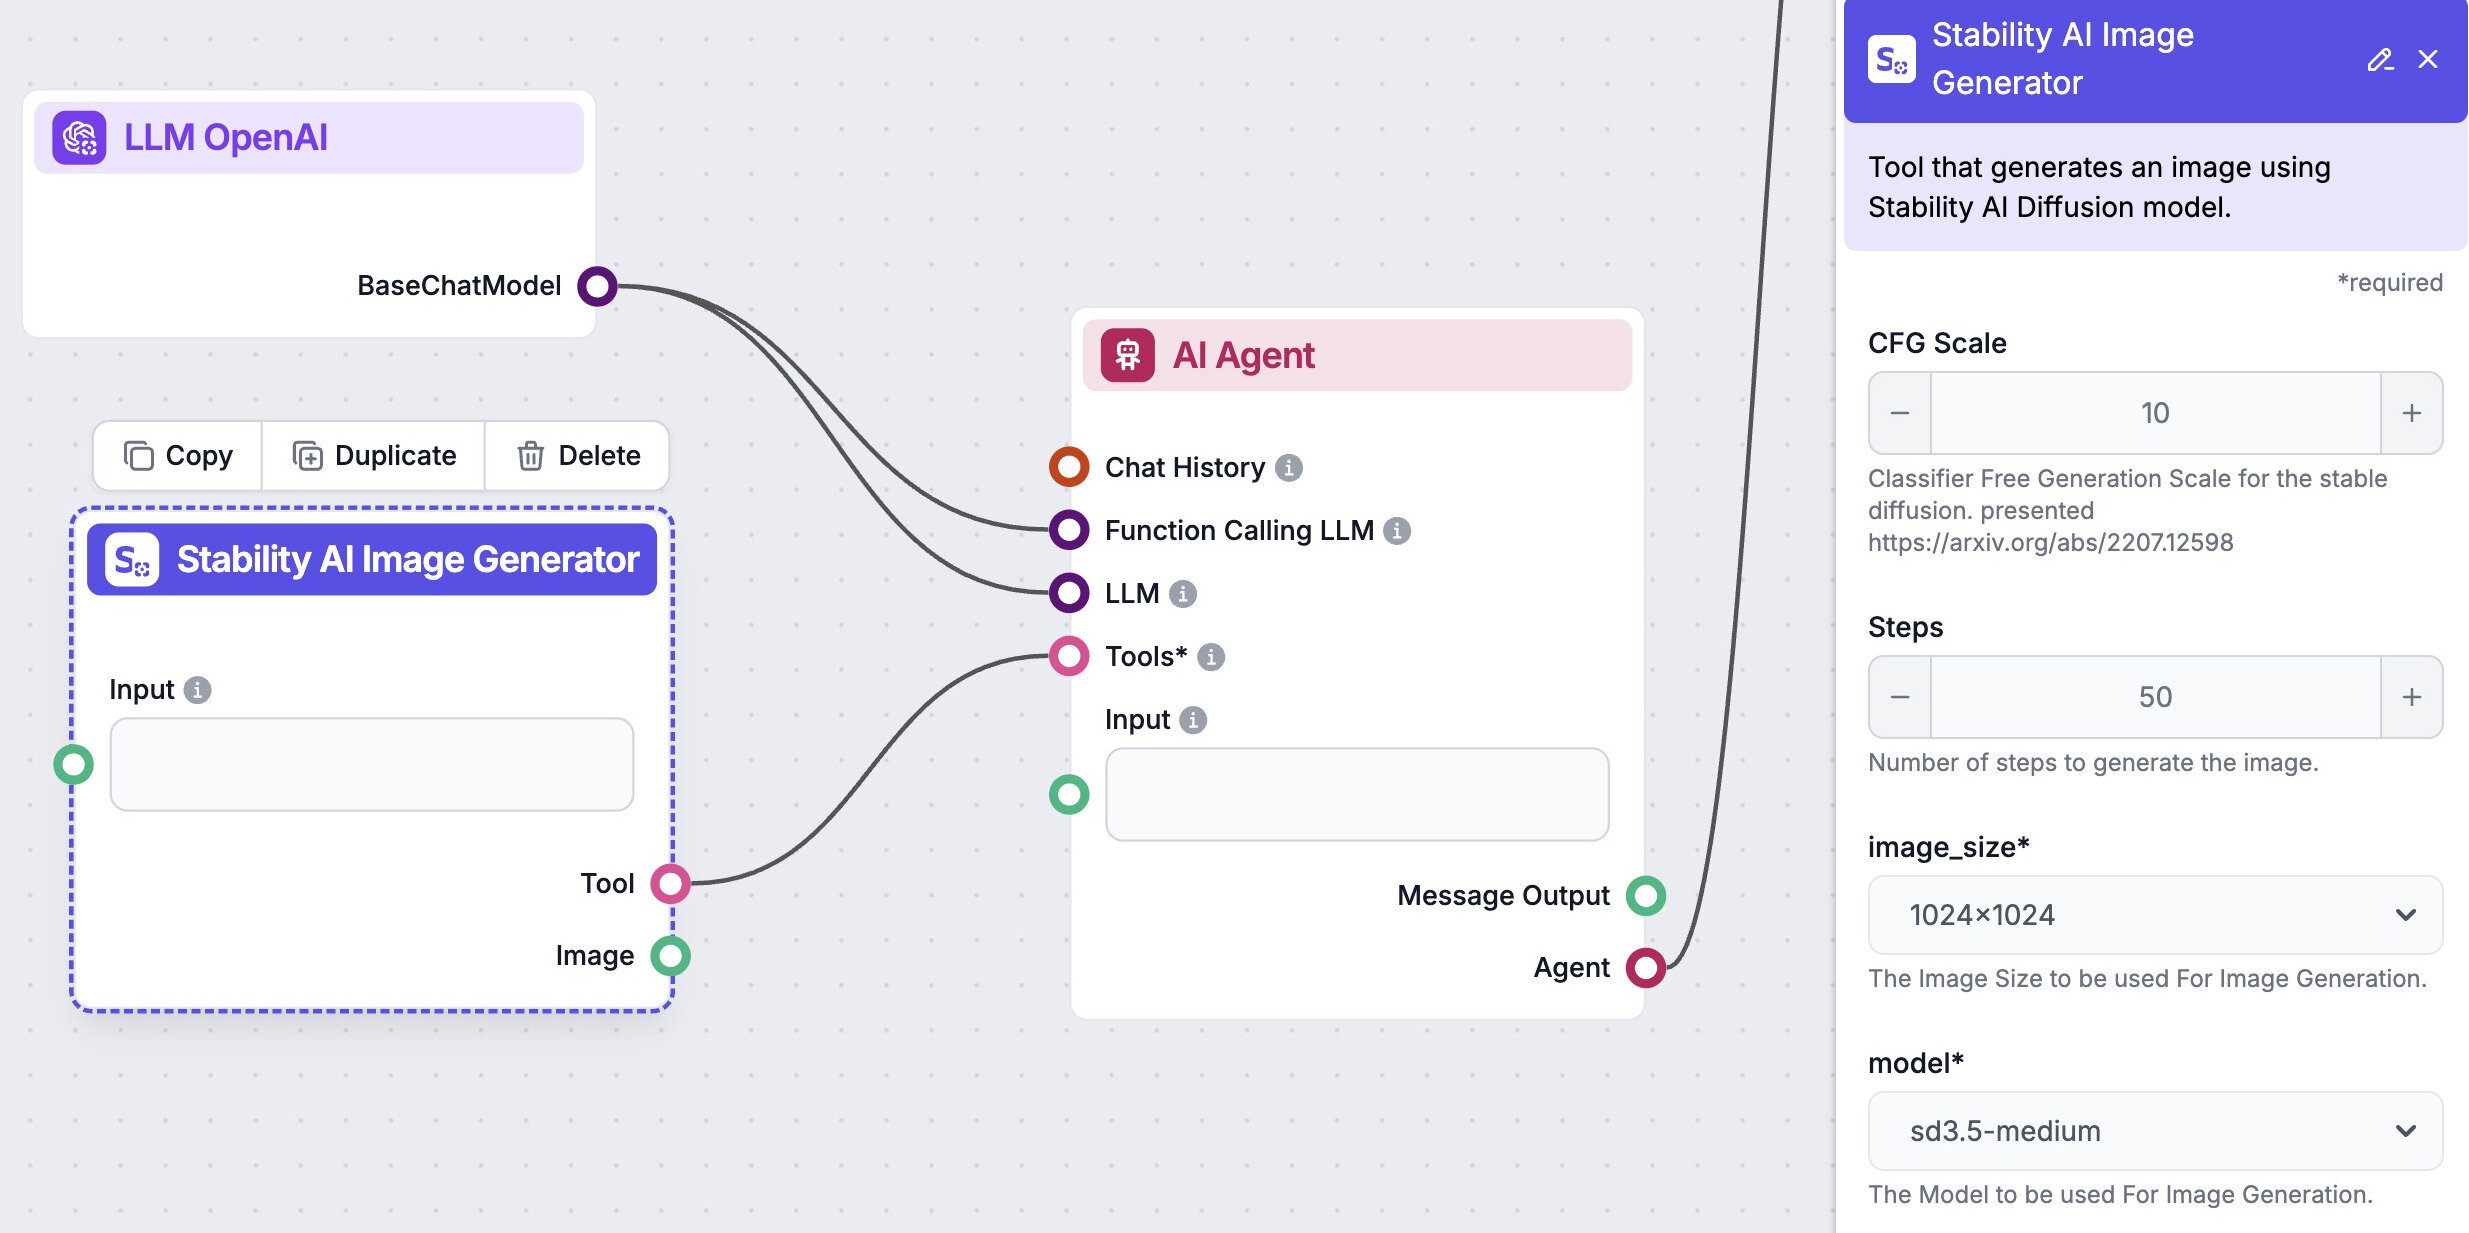
Automate your image generation with AI Agents
Generate At Scale With The Sustainability Report Visualizer
Frequently asked questions
- What is the Sustainability Report Visualizer effect?
It is a visual style that enhances business reports and presentations with eco-friendly, nature-inspired designs. This effect uses green palettes, clean layouts, and environmental motifs to communicate sustainability initiatives in a visually compelling way.
- Who should use this visual style?
This style is ideal for organizations, businesses, and NGOs looking to showcase their environmental efforts, sustainability metrics, or green impact reports in an engaging, professional format.
- Does this style work for all types of business documents?
While it is optimized for sustainability reports, annual reviews, and eco-driven presentations, it can also elevate any document where clarity, engagement, and a green message are priorities.
- Can I use the generated visuals commercially?
Yes, you can use visuals created with the Sustainability Report Visualizer for commercial purposes, including public reports, investor presentations, marketing collateral, and CSR communications.
- What makes this style different from regular report designs?
The Sustainability Report Visualizer combines modern infographic design with eco-themed elements and vibrant color schemes, making sustainability information more accessible, attractive, and memorable.
We automate marketing with AI
Let us help you automate your marketing tasks. Our platform allows you to create custom AI chatbots, agents, and workflows that can handle a wide range of tasks, from customer support to content generation.
- High-Quality Visual Content
Generate professional marketing visuals in seconds. Our AI creates stunning images that maintain brand consistency across all your campaigns without expensive design services.
- Content Creation at Scale
Produce large volumes of customized content efficiently. Create hundreds of images, blog posts, and marketing materials simultaneously with our AI automation workflows.
- Custom Brand Identity
Train AI models on your brand assets to create unique, on-brand visuals for any campaign. Maintain consistent visual identity across all marketing channels with character training technology.