
Style
Scientific Diagram Generator
The Scientific Diagram Generator style empowers researchers, educators, and professionals to create visually compelling diagrams tailored for R&D reports, presentations, and publications. With vibrant colors, clean layouts, and a modern aesthetic, this effect transforms complex data and concepts into accessible, eye-catching visuals. Whether illustrating DNA structures, chemical processes, or energy systems, the Scientific Diagram Generator ensures clarity, engagement, and professionalism in every graphic.
Train AI Image Models
Train your own Character
Train a unique character from your own everyday photos, apply the ready to use Scientific Diagram Generator to generate interesting and eye-catching images.

Input Image
Starting point for AI training is set of your images. More images of same character can be added to improve the model.
Pretrained AI model
Apply ready to use styles and effects on pretrained model or use custom prompt to generate images.


AI Generated Character with custom style
Images generated from the pretrained model
Enhance Your Reports with Scientific Diagram Generator
Communicate complex ideas clearly and professionally with Photomatic’s Scientific Diagram Generator. Instantly create stunning diagrams and data visuals that elevate your research presentations, publications, and educational content.
What is the Scientific Diagram Generator Style? Description and History
The Scientific Diagram Generator style is designed to bridge the gap between technical accuracy and visual engagement. By leveraging vibrant colors, minimalist layouts, and modern design cues, this style transforms dense scientific information into clear, digestible diagrams. It originated as a response to the need for better science communication in academia, industry, and education—where effective visuals can make complex data understandable to wider audiences.
Over the years, advances in data visualization, infographics, and digital publishing have influenced the evolution of scientific diagrams. Today, the Scientific Diagram Generator draws on these trends, making it easier than ever to produce graphics that are both informative and visually appealing, even for users without a design background.
Who is Using the Scientific Diagram Generator Style?
- Researchers and Scientists: To illustrate findings in journal articles, posters, and presentations.
- Teachers and Educators: For creating classroom materials, textbooks, and interactive lessons.
- Students: To enhance assignments, reports, and thesis documents with professional-quality visuals.
- Corporate R&D Teams: For internal reports, technical documentation, and investor presentations.
- Science Communicators and Journalists: To make complex concepts accessible to the public.
- Medical and Engineering Professionals: For clear and precise process diagrams and data visualizations.
Examples of this effect
DNA Structure
Prompt: scientific diagram of a DNA double helix, data visuals, vibrant colors, clean layout, modern style
Renewable Energy
Prompt: scientific diagram of renewable energy sources, clean and modern layout, vibrant colors, clear data visuals, modern style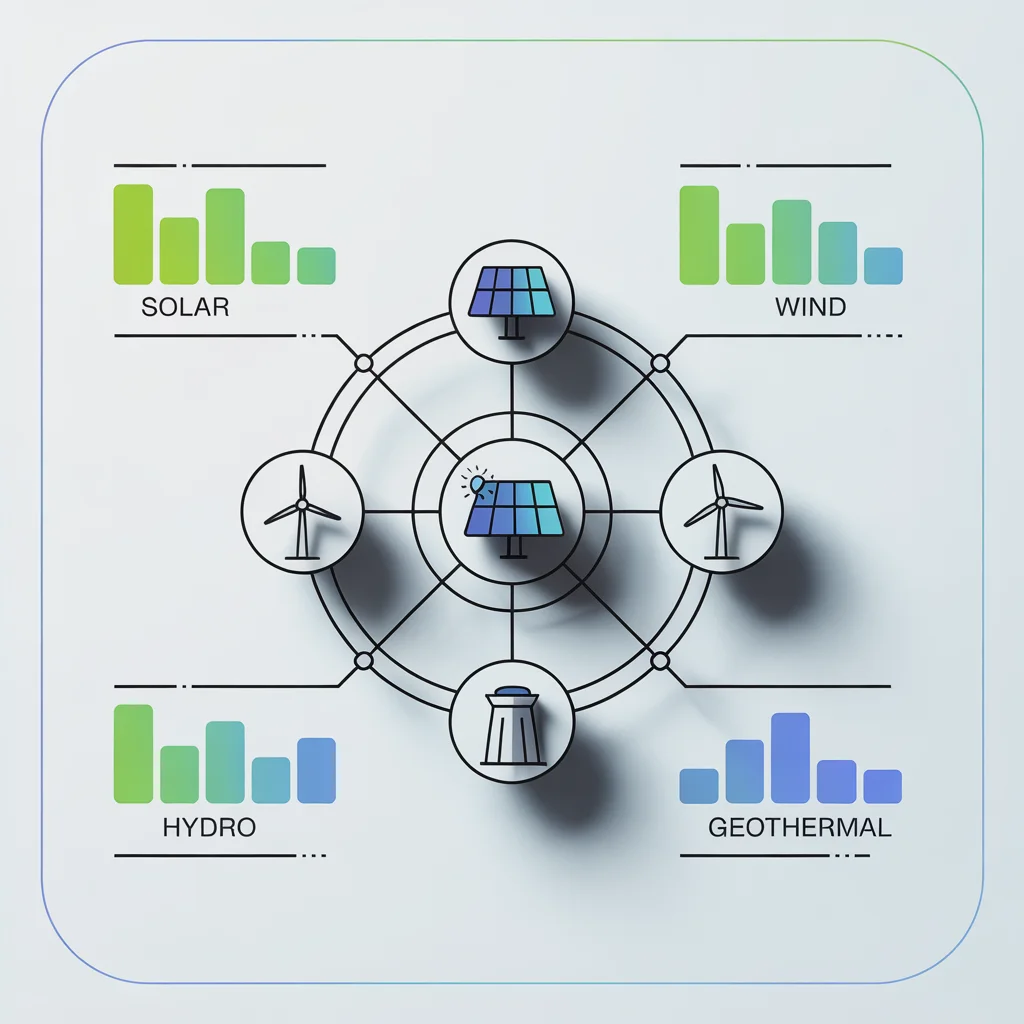
[Image unavailable for: Chemical Reaction Process]
How Does the Scientific Diagram Generator Enhance Photos and Data Visuals?
- Clear Communication: Translates complex concepts and datasets into easy-to-understand graphics.
- Vibrant Colors: Engages the audience and distinguishes different data elements or processes.
- Clean, Modern Layouts: Reduces clutter and focuses attention on key information.
- Professional Aesthetic: Elevates the perceived quality and credibility of reports and presentations.
- Customizable: Adapts to various scientific fields, from biology to engineering and beyond.
Use Cases for Scientific Diagram Generator: When and Why to Use It
1. Academic Research Publications
Publishers and researchers use this style to ensure that figures and diagrams in scientific papers are both accurate and visually appealing, increasing their impact.
2. Conference Presentations
A clean, colorful diagram can make your oral or poster presentation memorable and understandable, especially in multidisciplinary settings.
3. Educational Materials
Teachers and textbook authors use this style to make lessons engaging and to help students grasp abstract or complex concepts quickly.
4. Corporate R&D and Investor Reports
Modern scientific diagrams clarify technical processes and data for stakeholders, investors, and team members who may not have deep scientific backgrounds.
5. Public Science Communication
Science communicators and journalists rely on attractive, easy-to-read diagrams when presenting information to the general public or younger audiences.
Pro Tips for Using the Scientific Diagram Generator Style
- Keep It Simple: Focus on the essential information to avoid overwhelming your audience.
- Use Color Strategically: Assign colors to categories or data types for instant recognition.
- Prioritize Readability: Choose clear fonts and make sure text contrasts well with the background.
- Maintain Consistency: Use similar shapes, colors, and layouts across multiple diagrams for a cohesive look.
- Validate Accuracy: Always double-check data and scientific details before sharing or publishing.
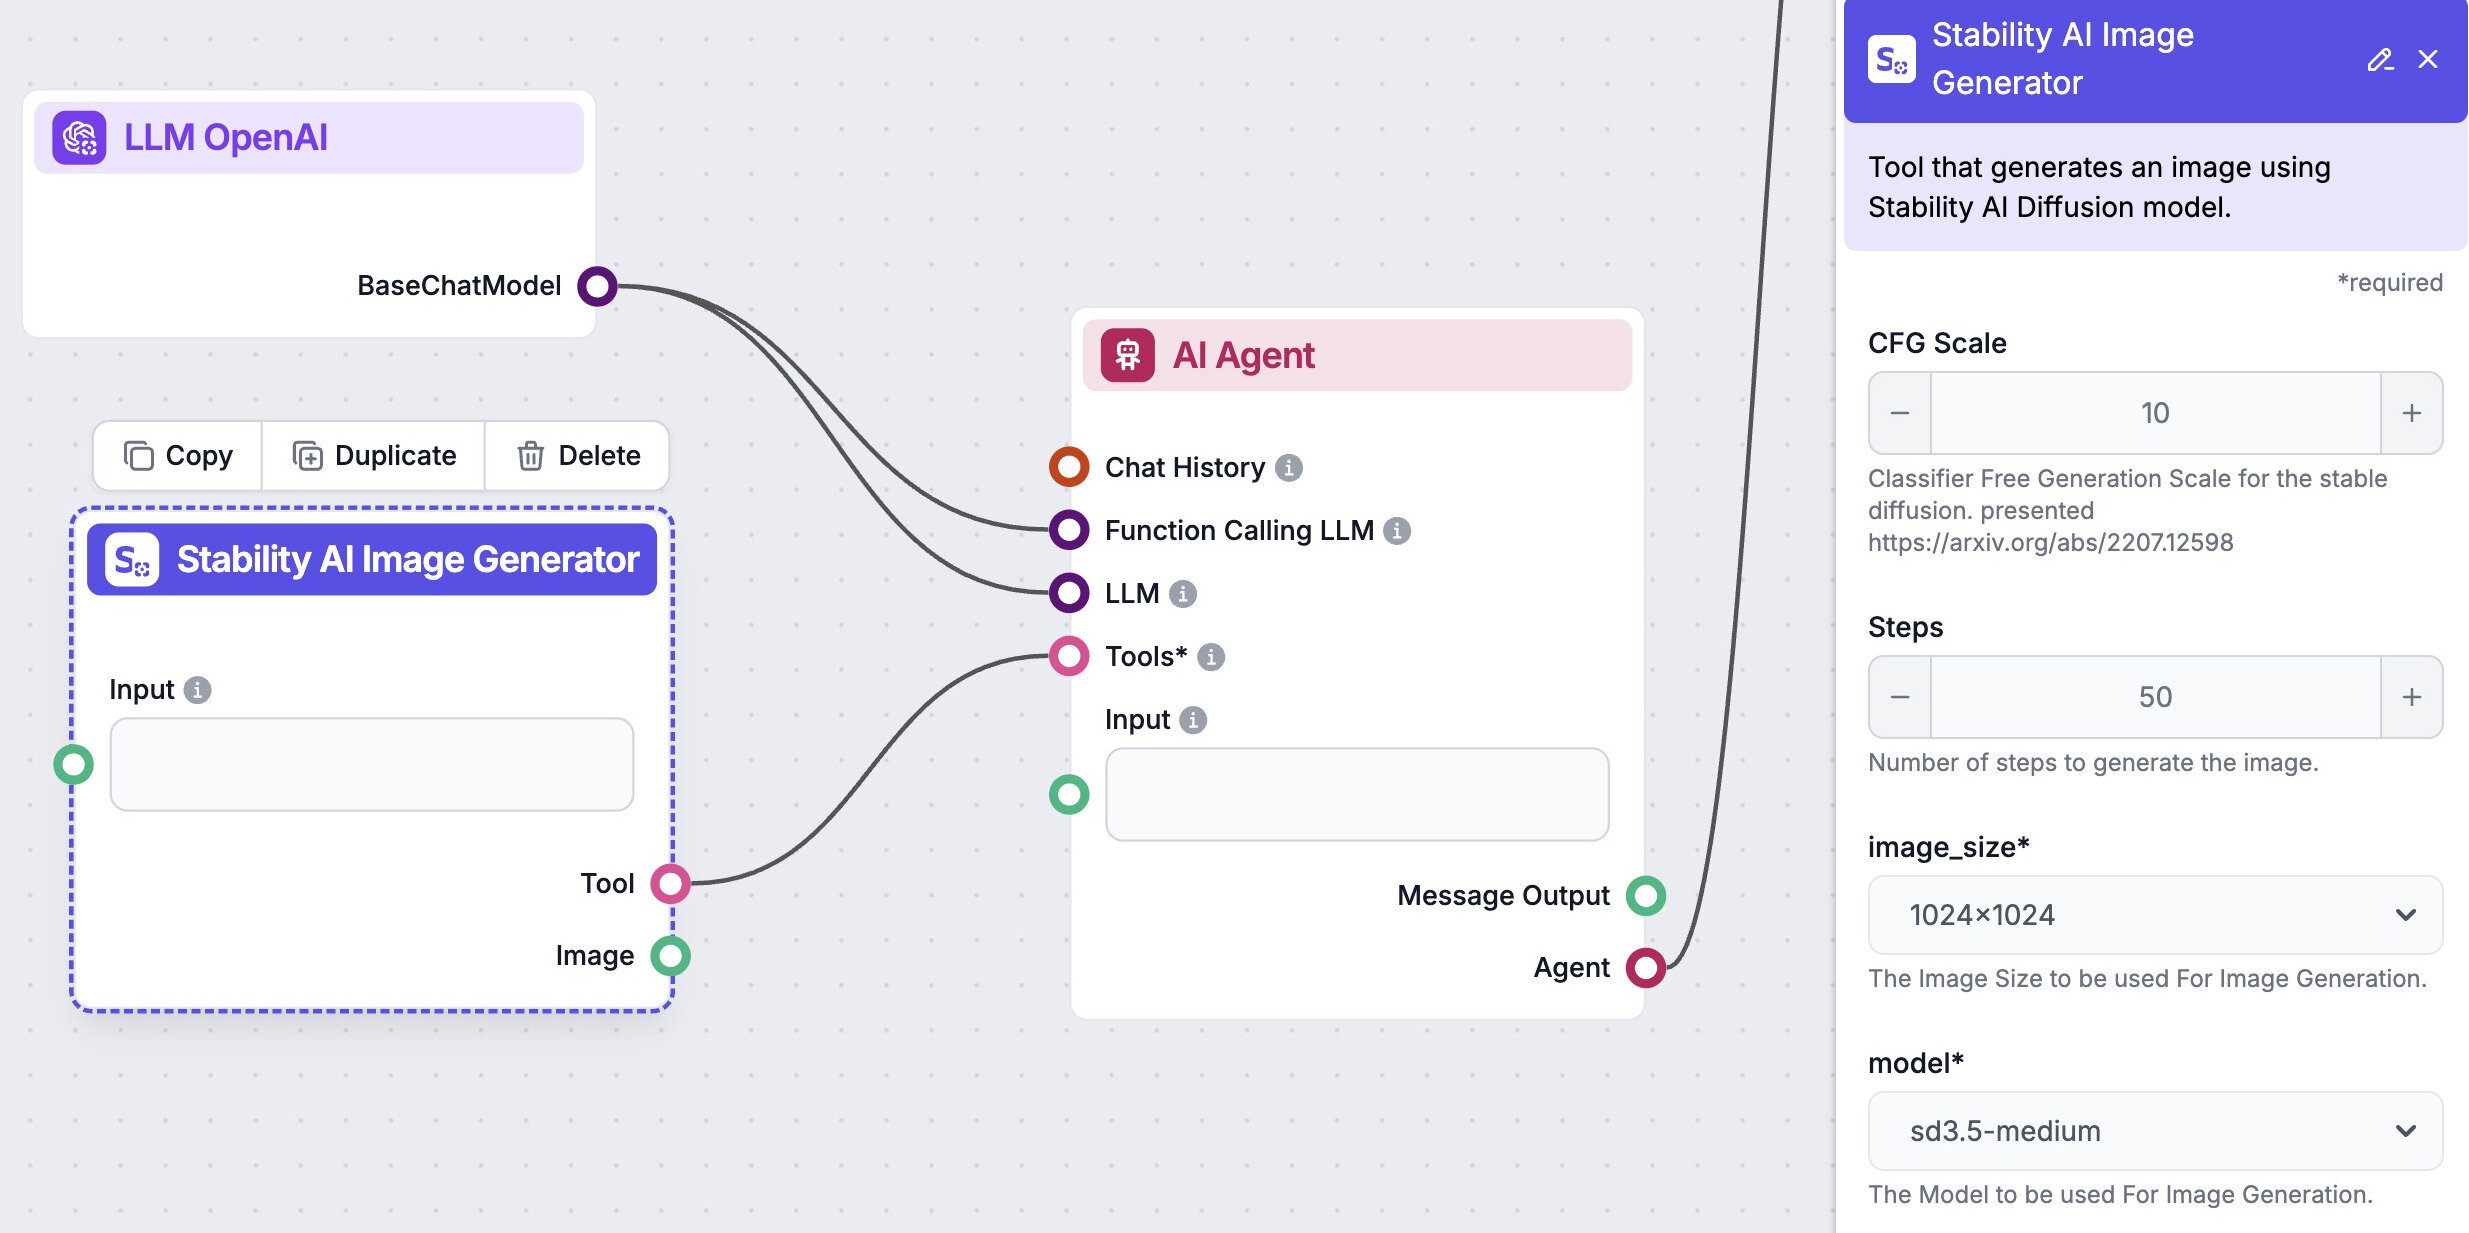
Automate your image generation with AI Agents
Generate At Scale With The Scientific Diagram Generator
Frequently asked questions
- What makes the Scientific Diagram Generator style unique?
This style combines modern design principles with scientific accuracy, using vibrant colors, clean layouts, and intuitive visuals. It’s perfect for turning complex research data or scientific concepts into accessible graphics for any audience.
- Who can benefit from using the Scientific Diagram Generator?
Researchers, educators, students, and professionals in science, engineering, medicine, and technology use this style to create impactful diagrams for reports, presentations, and educational materials.
- What types of content work best with this style?
Scientific diagrams, data charts, process flows, molecular structures, infographics, and any content that benefits from visual clarification and modern aesthetics.
- Can I use these generated diagrams in publications or presentations?
Yes! The diagrams produced with this style are suitable for academic publications, conference presentations, classroom materials, and corporate reports. Just ensure you have the rights to all underlying data and content.
- How do I create a diagram using this style with Photomatic?
Simply describe the scientific concept, data, or process you want to visualize. The AI generator will create a clean, vibrant, and modern diagram tailored to your needs, ready for download and use.
We automate marketing with AI
Let us help you automate your marketing tasks. Our platform allows you to create custom AI chatbots, agents, and workflows that can handle a wide range of tasks, from customer support to content generation.
- High-Quality Visual Content
Generate professional marketing visuals in seconds. Our AI creates stunning images that maintain brand consistency across all your campaigns without expensive design services.
- Content Creation at Scale
Produce large volumes of customized content efficiently. Create hundreds of images, blog posts, and marketing materials simultaneously with our AI automation workflows.
- Custom Brand Identity
Train AI models on your brand assets to create unique, on-brand visuals for any campaign. Maintain consistent visual identity across all marketing channels with character training technology.